About the Dashboard
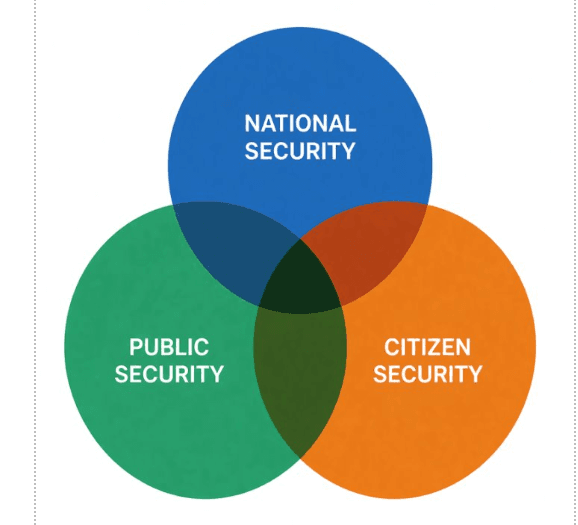
The Central America Security Trends Dashboard was developed in Summer 2026 as part of an ongoing project from Jack D. Gordon Institute for Public Policy at Florida International University. Based on comprehensive regional research, this interactive tool is designed to track and visualize the complex, divergent security landscapes across Central America. Recognizing that security is about more than just the reduction of homicides, the Dashboard highlights how different nations confront organized crime and whether states are successfully restoring legitimate territorial authority.
To capture and visualize these developments, the Dashboard incorporates and regularly updates data across three distinct but interconnected security dimensions:
- National Security: This dimension evaluates threats to state authority, territorial control, border integrity, strategic infrastructure, and national stability. It goes beyond conventional warfighting to capture penetration by transnational organized crime, cross-border illicit flows, attacks on state actors, prison system destabilization, and strategic corruption or capture.
- Public Security: Focused on the law-enforcement and public-order domain, this category tracks geographically concentrated crime patterns. It includes data on homicides, robbery, theft, extortion, assault, kidnapping, gang violence, riots, prison disturbances, and illicit seizures.
- Citizen Security: Representing the human-centered dimension of security, this category is distinct from conventional state-centered approaches. It focuses on the protection of people and democratic coexistence by measuring fear, victimization, mobility constraints, perceptions of insecurity, willingness to report crime, and community-level trust and confidence in the state.
The Dashboard focuses its analysis specifically on four countries—Costa Rica, Guatemala, Honduras, and El Salvador—which together reveal the full diversity of Central America's security trajectories. Rather than moving along a single regional path, all four countries face distinct pressures:
- Costa Rica represents a historically stable democracy dealing with a rapid, logistics-linked surge in organized crime and homicide.
- Guatemala illustrates the persistence of extortion, prison-based criminal command, and weak justice institutions testing a democratic reform agenda.
- Honduras highlights a post-exception transition where peak homicides have dropped, yet communities still live under severe criminal governance, territorial fear, and institutional mistrust.
- El Salvador presents the region's most dramatic drop in visible gang violence, though its success relies on a consolidated emergency-security model that raises significant concerns regarding due process, civic space, and institutional risk.
By tracking these unique national realities, the Dashboard illustrates the central challenge facing the region today: finding security models firm enough to confront armed, extortionary criminal structures, yet disciplined enough to preserve institutional legitimacy, due process, and citizen trust.
Limitations
Accurately measuring the multidimensional nature of security across Costa Rica, Guatemala, Honduras, and El Salvador presents inherent methodological challenges. While official crime statistics provide a baseline, they frequently under count actual incidents of violence and extortion due to under reporting, fear of criminal retaliation, weak institutional trust, and limited independent access to detention and prison data. To capture a deeper, human-centered perspective, the underlying study incorporates focus group evidence; however, this qualitative data reveals mechanisms, perceptions, and lived experiences rather than statistically representative metrics. Furthermore, data collection methodologies vary by country. In El Salvador, for instance, focus groups were not conducted; instead, the assessment relies on expert interviews and open-ended Delphi surveys. While valuable, these expert and stakeholder perceptions are not directly equivalent to neighborhood-level testimonies and must be triangulated with independent sources, official data, and other qualitative evidence. Any future attempts to aggregate these Delphi indicators into a cross-country quantitative index will also require careful normalization, as scale directions vary across the survey questions.
The Dashboard relies on third-party event data and forecasting models that carry their own operational constraints. Incident tracking from the Armed Conflict Location & Event Data (ACLED) project depends heavily on publicly available reports, local source networks, and media coverage. As a result, fluctuations or gaps in the data may sometimes reflect changes in source access, the reporting environment, or the introduction of new monitoring networks rather than actual on-the-ground shifts in violence. ACLED also employs explicitly conservative fatality estimates, which may further contribute to the under counting of casualties.
To project future security trajectories, the Dashboard incorporates ACLED's Conflict Alert System (CAST). While CAST utilizes machine learning and historical reporting data to probabilistically forecast organized violence events at subnational levels, its predictive capability remains inherently bounded by the availability and accuracy of past data and carries statistical uncertainty. Crucially, the political and security landscapes in these four countries in 2026 are fast-moving. Sudden developments—such as elections, Attorney General or judicial transitions, shifts in state-of-exception measures, prison policies, or the release of new homicide data—can rapidly alter national trajectories. Therefore, the integrated Dashboard serves as a dynamic but point-in-time representation, requiring periodic updates to accurately reflect the complex, shifting realities of Central American security.
Data Sources
The Dashboard uses a mixed-methods approach to capture a complete picture of Central America's security. By combining historical research, community perspectives, expert surveys, and real-time incident tracking, the data allows for direct cross-country comparison while highlighting each nation's unique, fast-moving dynamics.
To map both physical violence and its broader societal impact, the underlying study relies on four distinct qualitative research methods:
| Data Source | Dashboard Objective |
|---|---|
| Desk Studies | Maps long-term trends, state responses, and regional comparisons. |
| Focus Groups* | Captures lived experiences, territorial fear, and institutional trust. |
| Expert Interviews | Adds depth to institutional, political, and investment risks. |
| Delphi Surveys | Ranks stakeholder perceptions of political, economic, and security risks. |
* Note: Due to operational constraints, focus groups were not conducted in El Salvador. Community impact there was assessed through expert interviews and open-ended survey responses.
To complement these qualitative pillars and official state crime statistics, the Dashboard integrates third-party data to track and predict physical violence. It uses the Armed Conflict Location & Event Data (ACLED) project (www.acleddata.com) for independent, near-real-time monitoring of security incidents—such as clashes or violence against civilians—down to the local level. Additionally, ACLED's Conflict Alert System (CAST) leverages machine learning and historical data to forecast potential political violence up to six months into the future.
ACLED Data Usage & Methodology: Data from ACLED is retrieved on a weekly basis to ensure near-real-time monitoring. The dataset is filtered to include events recorded from 2018 to the present day across Costa Rica, El Salvador, Guatemala, and Honduras. To align with the Dashboard's specific analytical framework, the original dataset was manipulated by re-categorizing standard ACLED event types into custom regional security classifications. Any data classified by ACLED as "Other" is explicitly excluded from the Dashboard.
Categories
The Dashboard breaks down Central America's complex landscape into three distinct security dimensions. By isolating these layers, the data allows users to differentiate between macro-level state threats, street-level criminal incidents, and the daily realities of citizens.
National Security
Tracks threats to state authority, territorial control, and national stability. This includes penetration by transnational organized crime, cross-border illicit flows, attacks on state actors, and major prison destabilizations.
Public Security
Focused strictly on the law-enforcement and public-order domain. This tracks geographically concentrated physical security incidents, including homicides, robberies, extortions, kidnappings, armed clashes, and gang violence.
Citizen Security
The human-centered dimension. This measures the community's lived experience, tracking regional data on public fear, victimization rates, mobility constraints, institutional trust, and the willingness to report crimes.
Indicator Groups
To maintain consistency and allow for direct cross-country comparison across Costa Rica, Guatemala, Honduras, and El Salvador, the Dashboard tracks underlying data across eight specific indicator groups:
| Indicator Group | Indicators |
|---|---|
| Violence and homicide | Homicide rate, homicide count, firearm share, collateral victims, femicide, youth victimization, clearance rate. |
| Extortion and criminal governance | Extortion complaints, victim sector, reported payments, business closures, public transport incidents, territorial restrictions, reporting behavior. |
| Prisons | Overcrowding, high-risk classification, communication seizures, prison-origin extortion, riots, custody deaths, monitoring access. |
| Justice and due process | Arrests, charges, convictions, pretrial detention, habeas corpus, public defender access, mass trials, case backlog. |
| Institutional trust and corruption | Police trust, judicial trust, corruption cases, internal-affairs outcomes, procurement audits, municipal integrity reviews. |
| Social cohesion and prevention | School dropout, youth unemployment, public-space use, migration/displacement, gender violence, program participation. |
| Investment and economy | FDI, tourism/security incidents, insurance and private-security costs, legal disputes, remittances, infrastructure disruption. |
| Civic space and data transparency | Media freedom, NGO restrictions, publication of crime/detention data, independent monitoring, access to information. |
References
Data Source Attributions
- ACLED Dataset: Clionadh Raleigh, Roudabeh Kishi, and Andrew Linke, “Political instability patterns are obscured by conflict dataset scope conditions, sources, and coding choices,” Humanities and Social Sciences Communications, 25 February 2023. https://doi.org/10.1057/s41599-023-01559-4